Audio Visualiser Converter
One tool, any version. Convert any audio file into a spectrogram-style image, optimized for both Free and Studio editions of DaVinci Resolve.
Try Audio Visualiser Converter Web Edition
No more downloading, Python installments for Mac users, or any concerns about security. Now it's all within your web browser. A seamless, professional workflow starting in seconds.
Try the Web EditionMade for the Audio Visualiser Plugin
The converter feeds its spectrogram images straight into the Audio Visualiser Plugin for DaVinci Resolve.

Features
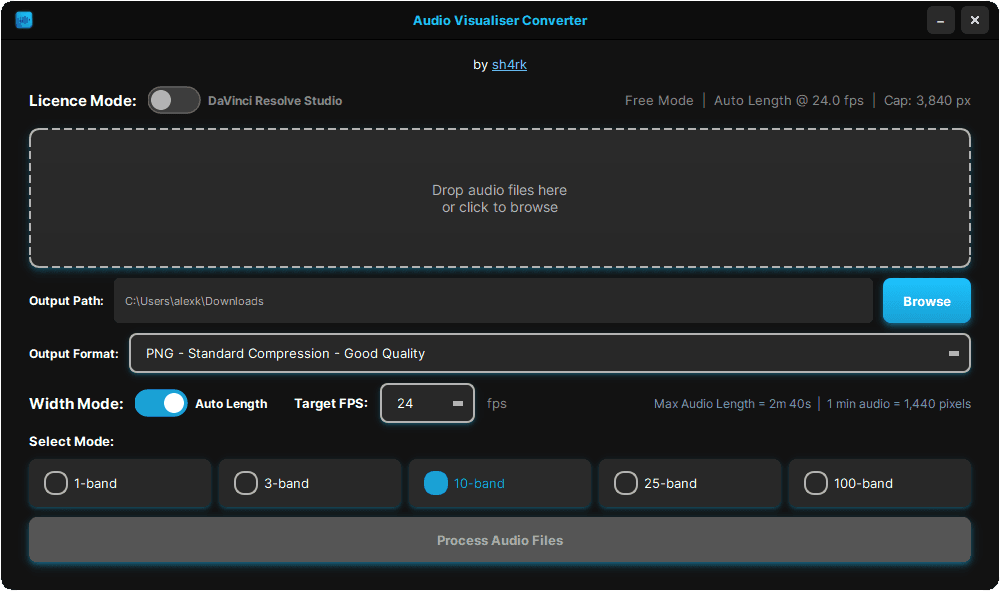
Auto Length Mode
The converter automatically calculates your audio length and project frame rate to output the perfect data spectrum. This ensures zero lag, perfect timing sync, and consistent smoothness for tracks up to 22 minutes long.
Simple drag & drop workflow
Drop audio files here
or click to browse
Auto Set Output Path
Automatically sets the output directory to the same location as your source audio file.
Frequency Band Modes
Displays the overall volume of the track over time with no frequency separation.
Separates the audio into low, mid, and high frequencies.
Splits audio into 10 logarithmically spaced frequency bands for detailed energy visualization.
Provides fine-grained frequency separation across 25 bands for spectral variations.
Offers maximum spectral precision with 100 logarithmically spaced bands, capturing every nuance of the audio spectrum.
Max Audio Length Limits
To ensure perfect synchronization, avoid exceeding these length limits for your project's frame rate. After the 1.2.0 update on the Audio Visualiser Plugin, exceeding these limits will not make your audio laggy. Instead, the movement will appear smoother as the engine interpolates the data that exceeds these limits.
| Project FPS | DaVinci Resolve Free Limit | DaVinci Resolve Studio Limit |
|---|---|---|
| 23.976 | 160.2 s (2m 40s) | 1334.7 s (22m 15s) |
| 24 | 160.0 s (2m 40s) | 1333.3 s (22m 13s) |
| 25 | 153.6 s (2m 33s) | 1280.0 s (21m 20s) |
| 29.97 | 128.1 s (2m 08s) | 1067.7 s (17m 48s) |
| 30 | 128.0 s (2m 08s) | 1066.7 s (17m 47s) |
| 48 | 80.0 s (1m 20s) | 666.7 s (11m 06s) |
| 50 | 76.8 s (1m 16s) | 640.0 s (10m 40s) |
| 59.94 | 64.1 s (1m 04s) | 533.9 s (8m 54s) |
| 60 | 64.0 s (1m 04s) | 533.3 s (8m 53s) |
How To Install
Option 1: Pre-compiled Windows App
- Download the `.exe` from GitHub.
- Run the application directly (no installation required).
Option 2: Run from Source (Advanced)
For macOS/Linux users or those who prefer running from the Python source.
git clone https://github.com/Analator1/Visualizer.gitcd Visualizerpip3 install -r requirements.txtpython3 Visualiser_Script.pyIf you have questions or require further help, feel free to join our Discord server.
How To Use
Upload Audio
Drag and drop or select your audio file.
Choose Output Location
Select where to save the image (defaults to the source folder).
Select Band Mode
Choose between 1, 3, 10, 25, or 100 frequency bands.
Processing
The application analyzes and converts your file instantly.
Get Your Image
Your high-resolution spectrogram is ready for DaVinci Resolve.
How Images Are Generated
- 1
Audio Normalization
Converts the file to WAV and balances volume levels for accurate analysis.
- 2
Frequency Splitting
Divides the audio into specific frequency bands from low to high.
- 3
Waveform Rendering
Generates visual waveform data for each individual frequency band.
- 4
Pixel Conversion
Converts waveforms into thin strips where brightness represents volume (white = loud, black = quiet).
- 5
Stacking & Combining
Combines all bands into a single vertical spectrogram image.
- 6
Cleanup
Removes temporary work files, leaving only your final high-resolution PNG.
Frequently Asked Questions
Reviews
Optimized Audio Processing
Try the Web Edition now for a setup-free experience, or download our specialized local tool for offline processing.